> For the complete documentation index, see [llms.txt](https://docs.dinmo.io/llms.txt). Markdown versions of documentation pages are available by appending `.md` to page URLs; this page is available as [Markdown](https://docs.dinmo.io/journeys/monitoring-and-troubleshooting.md).

# Monitor and troubleshoot a Journey

Once your Journey is published, you can monitor its activity, understand where profiles are, and investigate unexpected results.

DinMo provides three complementary views:

* The Journey canvas shows the latest known distribution of profiles.
* The **Activity** panel provides detailed metrics for a selected step.
* **Run history** provides information about each execution of the Journey.

## Monitor the current state

The Journey canvas displays the number of profiles currently associated with each step.

Select a step and open the **Activity** tab to view its detailed metrics:

* **Entered**: profiles that reached the step.
* **Current state**: profiles whose latest known position is this step.
* **Advanced**: profiles that completed the step and continued through the Journey.
* **Exited here**: profiles that left the Journey while they were at this step.

<figure><img src="https://3204318043-files.gitbook.io/~/files/v0/b/gitbook-x-prod.appspot.com/o/spaces%2FxzBTp1t4OfqV67nXkVse%2Fuploads%2Fgit-blob-bc86b314b9445de522780a11704908e8e62823e5%2Fjourney-monitor-activity.png?alt=media" alt="Activity panel for a Wait step showing entered, current state, advanced, and exited metrics"><figcaption><p>Select a step and open Activity to understand how profiles progressed through it.</p></figcaption></figure>

These metrics help you understand how profiles progress through the Journey and identify steps where they may be waiting or exiting.

{% hint style="info" %}
The current state is calculated after the latest successfully completed run. It is not updated in real time.
{% endhint %}

The timestamp displayed in the panel indicates when the current state was last updated.

### Understand activity notices

The Activity panel may display a notice instead of, or alongside, the metrics:

* **No successful run**: the Journey has not completed a successful run yet.
* **Run in progress**: the latest run is scheduled, queued, or running. The displayed current state may not include its results yet.
* **Latest run failed**: the current state still reflects the previous successful run.
* **Partial activity data**: some earlier executions are not included in the displayed metrics.
* **Statistics unavailable**: activity metrics could not be calculated for the selected step.

Use the notice and the last-updated timestamp before drawing conclusions from the figures.

## Review the run history

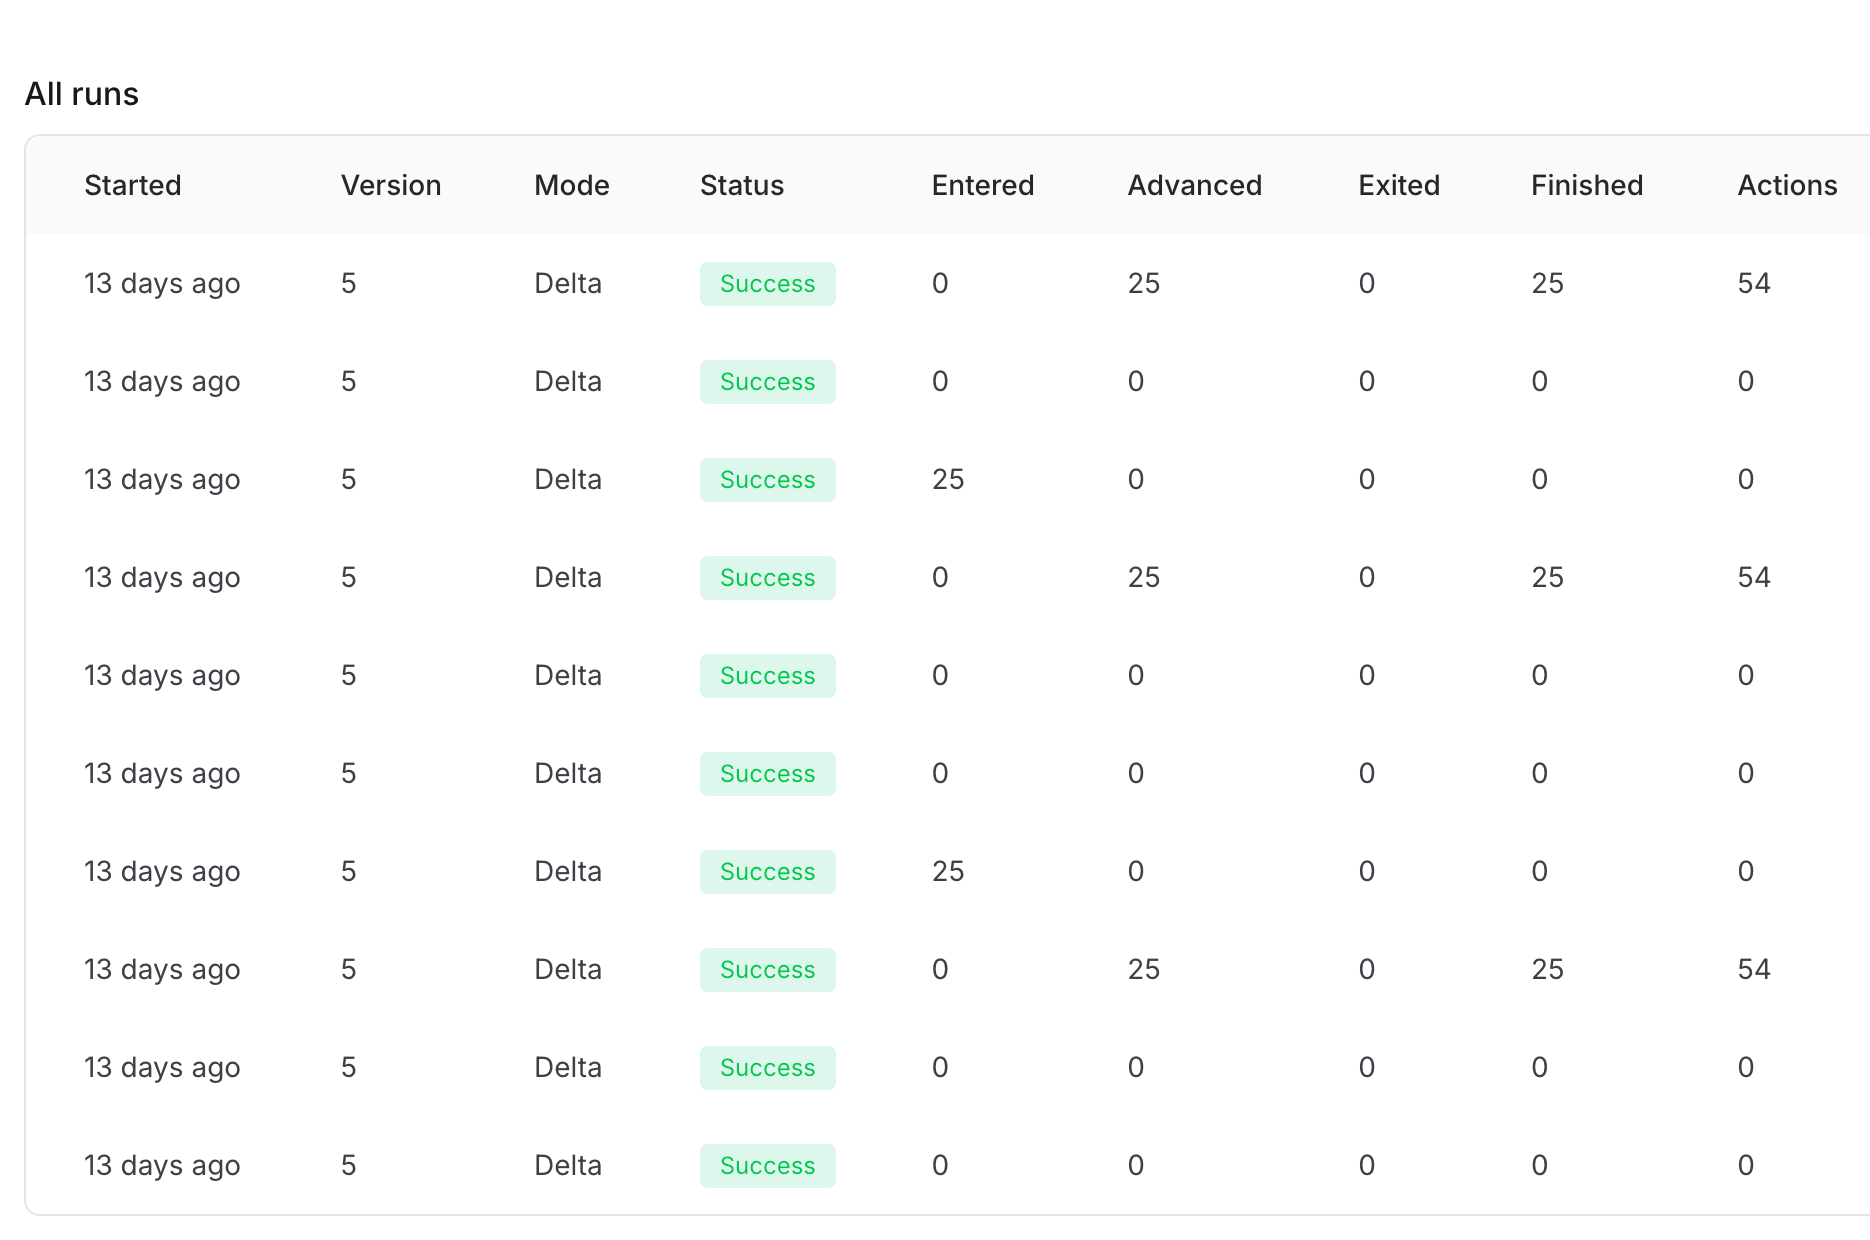
When **Run history** is available in your workspace, open it from the Journey header to review previous executions.

<figure><img src="https://3204318043-files.gitbook.io/~/files/v0/b/gitbook-x-prod.appspot.com/o/spaces%2FxzBTp1t4OfqV67nXkVse%2Fuploads%2Fgit-blob-0bbf26457423c5c5bb58f3b629a6fc4040ec5fce%2Fjourney-monitor-run-history.png?alt=media" alt="Journey run history table showing version, mode, status, and profile progression metrics"><figcaption><p>Run history lets you compare Journey executions and the version used for each run.</p></figcaption></figure>

For each run, you can see:

* **Started**: when the execution started.
* **Version**: the Journey version used for the execution.
* **Mode**: the type of execution. Test executions are identified as simulations.
* **Status**: whether the run is scheduled, queued, running, successful, or failed.
* **Entered**: profiles that entered the Journey during the run.
* **Advanced**: profiles that progressed to another step.
* **Exited**: profiles that left the Journey.
* **Finished**: profiles that reached the end of a path.
* **Actions**: actions executed by Activate steps.

A dash means that the information was not reported for that run, which may be the case for some earlier executions.

{% hint style="warning" %}
A successful run means that the Journey completed without an execution error. It does not necessarily mean that profiles entered the Journey, progressed, or triggered an action.
{% endhint %}

For example, a successful run with no new entries may simply mean that no profile matched the entry rules at that time.

## Investigate unexpected behavior

Start with the symptom you observe, then compare the Journey canvas, the selected step's Activity panel, and the run history.

### No profiles entered the Journey

Check that:

1. The latest run completed successfully.
2. Enrollment is open and the Journey is not paused.
3. The entry rules match profiles in the source model.
4. The source data was refreshed before the Journey ran.
5. You are reviewing the version used by the latest run.

If re-entry is allowed, also check that the configured re-entry delay has elapsed.

### Profiles are not progressing

Select the step where profiles are currently located and open its **Activity** tab.

Profiles may legitimately remain at a:

* **Wait** step until its duration has elapsed.
* **Pause Until** step until the expected event occurs or the timeout is reached.

Also check whether the Journey is paused or whether its latest run is still in progress.

### Fewer actions were executed than expected

Check that profiles:

1. Entered the Journey.
2. Reached the relevant Activate step.
3. Did not exit at an earlier step.
4. Matched the branch leading to that action.

Then verify the Activate step configuration and inspect the latest run for a failure or error details.

### Activity figures appear outdated

Check:

* The timestamp of the latest successful run.
* Whether another run is currently in progress.
* Whether the latest run failed.
* Whether the Activity panel reports partial or unavailable statistics.
* Which Journey version was used for the execution.

The canvas and Activity panel may continue to show the previous successful state while a newer run is running or after it has failed.

### A run failed

Open the failed run and review its error details when they are available.

Record the following information before investigating or contacting support:

* The execution date and time.
* The Journey version.
* The error code and message.

Investigate the cause before triggering another run, as the same configuration may produce the same failure again.

## Resolve validation issues

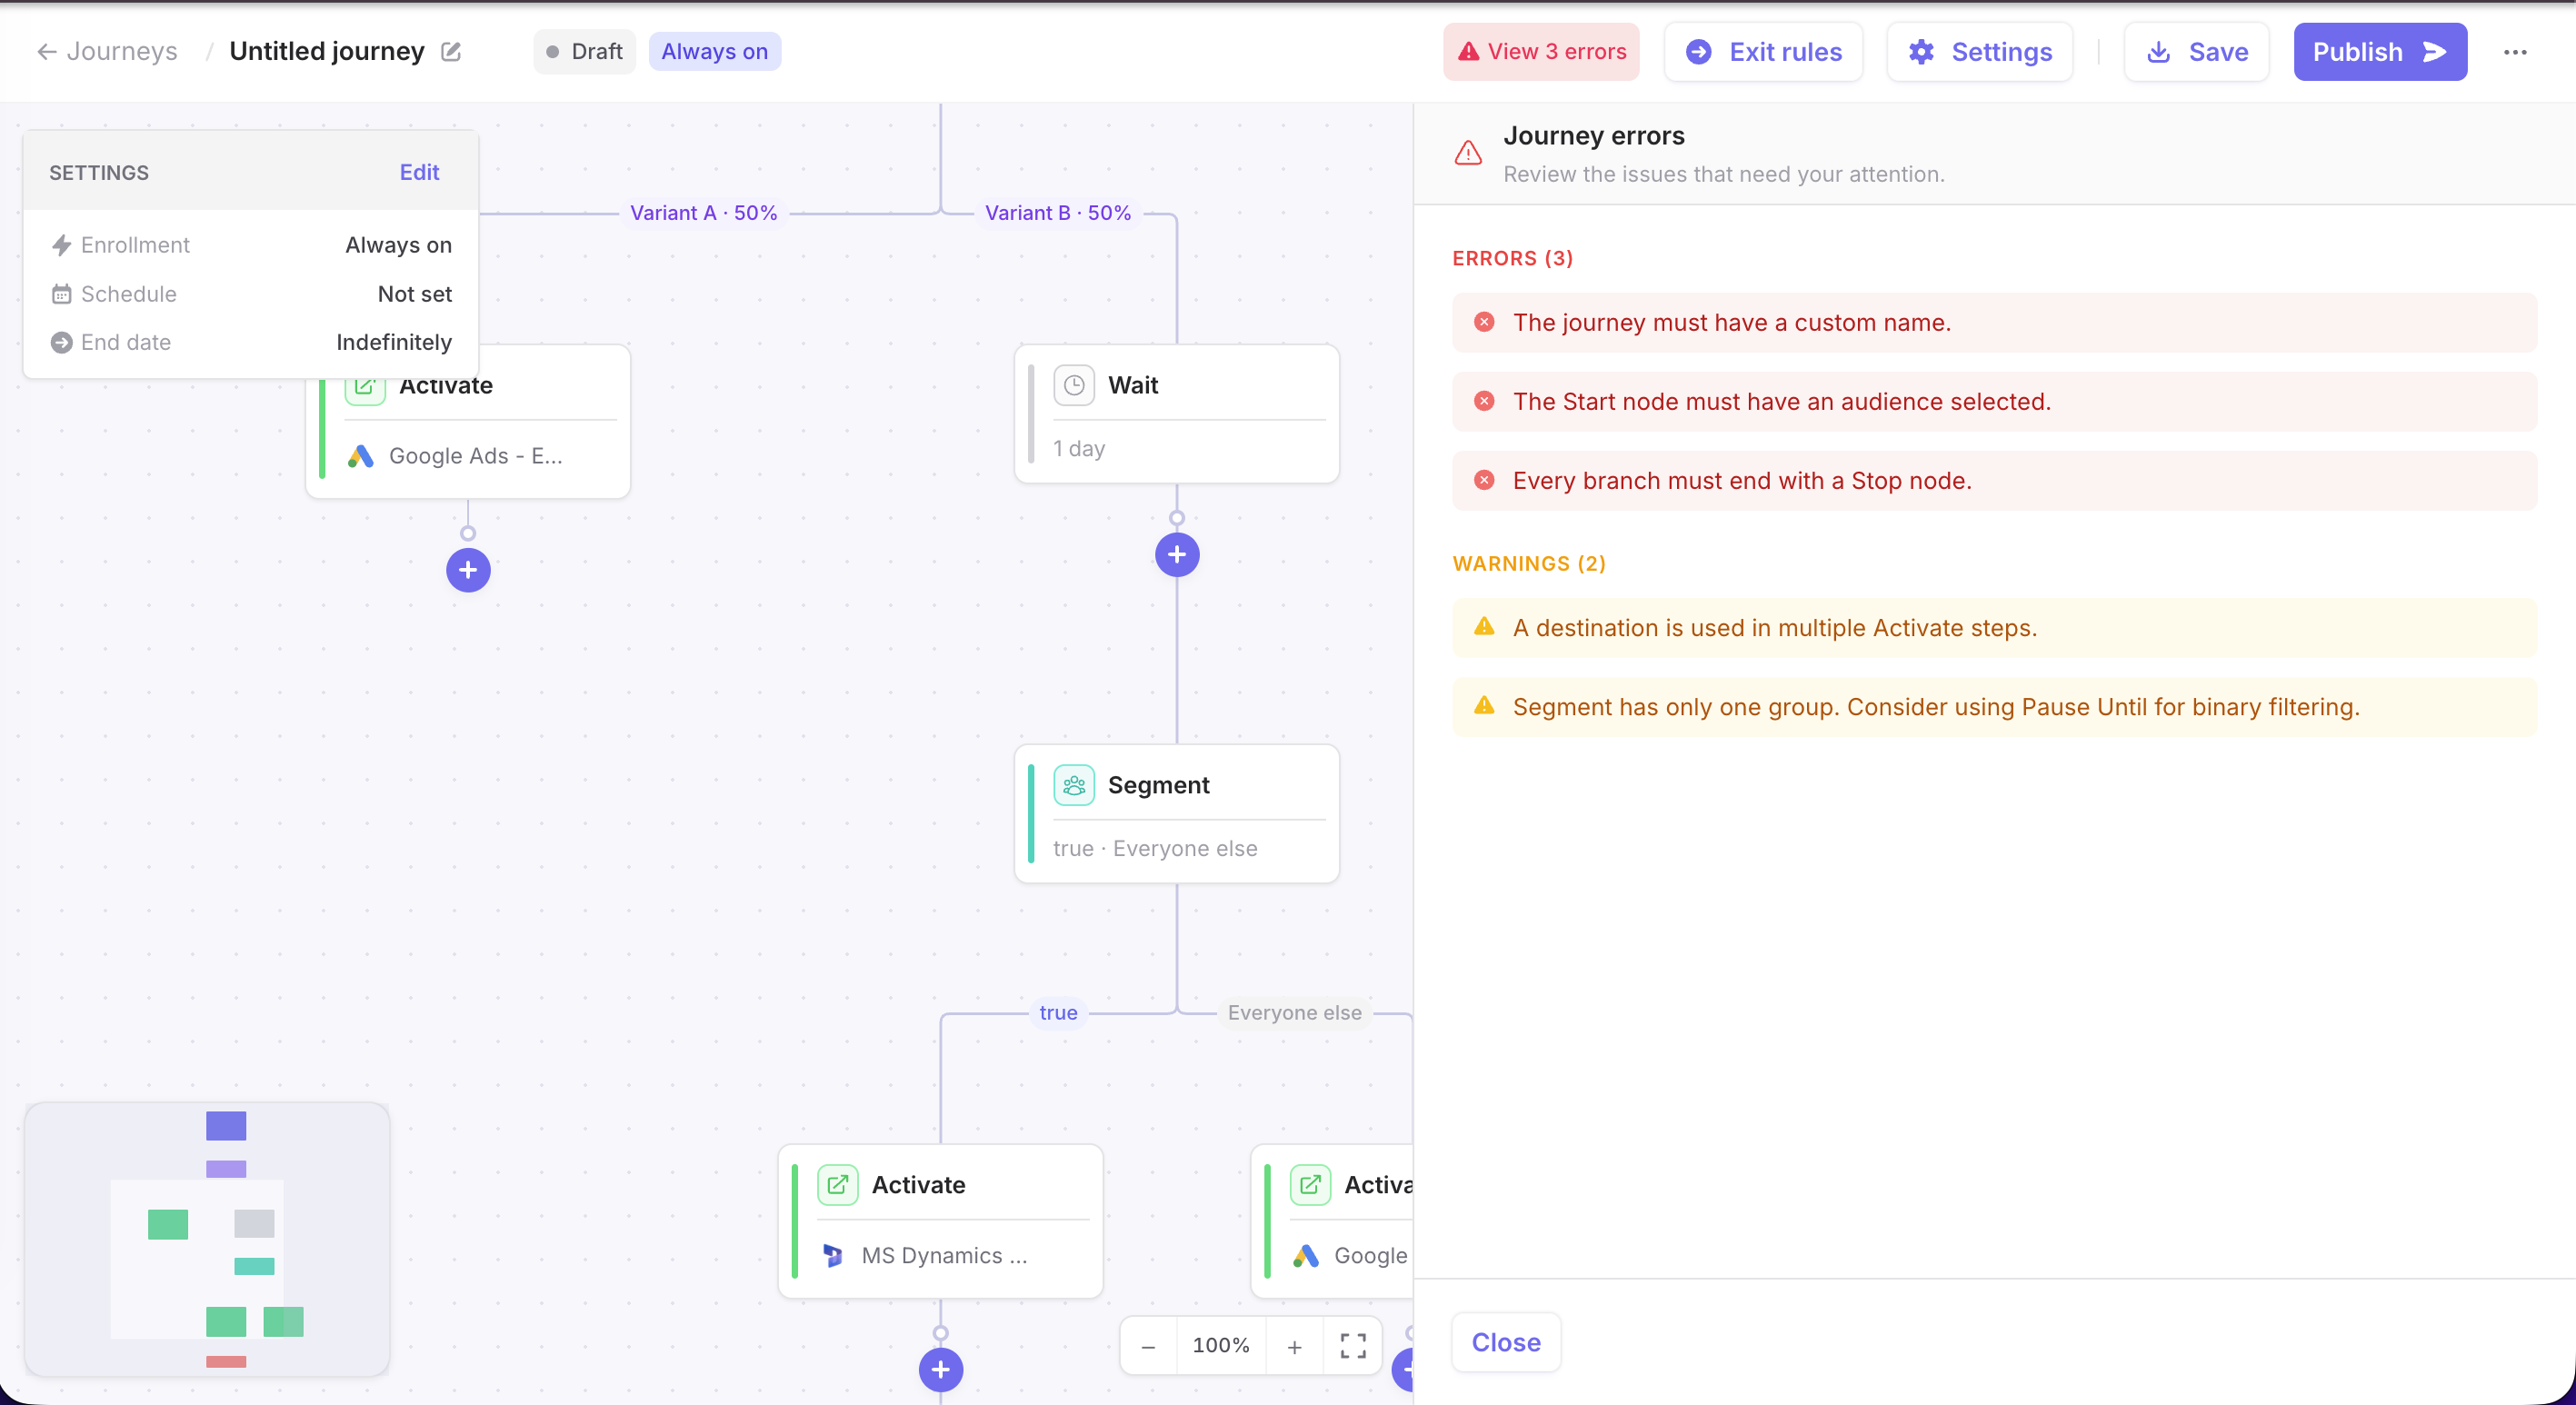
Before publication, select **View errors** to open the validation panel. Selecting an issue helps you locate the related step on the canvas.

<figure><img src="https://3204318043-files.gitbook.io/~/files/v0/b/gitbook-x-prod.appspot.com/o/spaces%2FxzBTp1t4OfqV67nXkVse%2Fuploads%2Fgit-blob-86d98866b2d62430f68a1c87670e54637f3ef302%2Fjourney-monitor-validation.png?alt=media" alt="Journey validation panel listing blocking errors and non-blocking warnings"><figcaption><p>Resolve every error before publishing and review each warning against the intended Journey behavior.</p></figcaption></figure>

Validation issues are divided into two categories:

| Type        | Effect                                                      | Recommended action                                     |
| ----------- | ----------------------------------------------------------- | ------------------------------------------------------ |
| **Error**   | Blocks publication                                          | Resolve it before publishing                           |
| **Warning** | Does not block publication, but identifies a potential risk | Review it and confirm that the behavior is intentional |

Common blocking errors include:

* A missing custom Journey name.
* A Start step without a configured entry audience or event.
* An incomplete step configuration.
* A branch that does not end with a Stop step.
* An invalid Journey structure or exit rule.

Warnings can highlight designs that are valid but may need additional review. For example, DinMo may warn you when:

* The same destination is used in multiple Activate steps.
* A Segment step contains only one group.
* A path contains a long or unusual sequence of Wait steps.
* A branch contains no Activate step.
* Re-entry is enabled without a delay before the first activation.

After correcting an issue, review the validation panel again. Resolving one configuration problem may reveal another issue elsewhere in the Journey.

## Related pages

* [Configure entry, re-entry, and exit rules](/journeys/entry-rules.md)
* [Configure Journey steps and branches](/journeys/steps-and-branches.md)
* [Publish and manage a Journey](/journeys/publish-pause-and-resume-a-journey.md)


---

# Agent Instructions
This documentation is published with GitBook. GitBook is the documentation platform designed so that both humans and AI agents can read, navigate, and reason over technical content effectively. Learn more at gitbook.com.

## Querying This Documentation
If you need additional information that is not directly available in this page, you can query the documentation dynamically by asking a question.

Perform an HTTP GET request on the current page URL with the `ask` query parameter, and the optional `goal` query parameter:

```
GET https://docs.dinmo.io/journeys/monitoring-and-troubleshooting.md?ask=<question>&goal=<endgoal>
```

`ask` is the immediate question: it should be specific, self-contained, and written in natural language.
`goal` is optional and describes the broader end goal you are ultimately trying to accomplish on behalf of the user. GitBook uses it to tailor the answer towards what is most useful for that goal.

The response will contain a direct answer to the question and relevant excerpts and sources from the documentation.

Use this mechanism when the answer is not explicitly present in the current page, you need clarification or additional context, or you want to retrieve related documentation sections.