> For the complete documentation index, see [llms.txt](https://docs.dinmo.io/llms.txt). Markdown versions of documentation pages are available by appending `.md` to page URLs; this page is available as [Markdown](https://docs.dinmo.io/models/overview/graph-view.md).
# Graph view
Explore the relationships and dependencies between models in your DinMo workspace.
## Overview
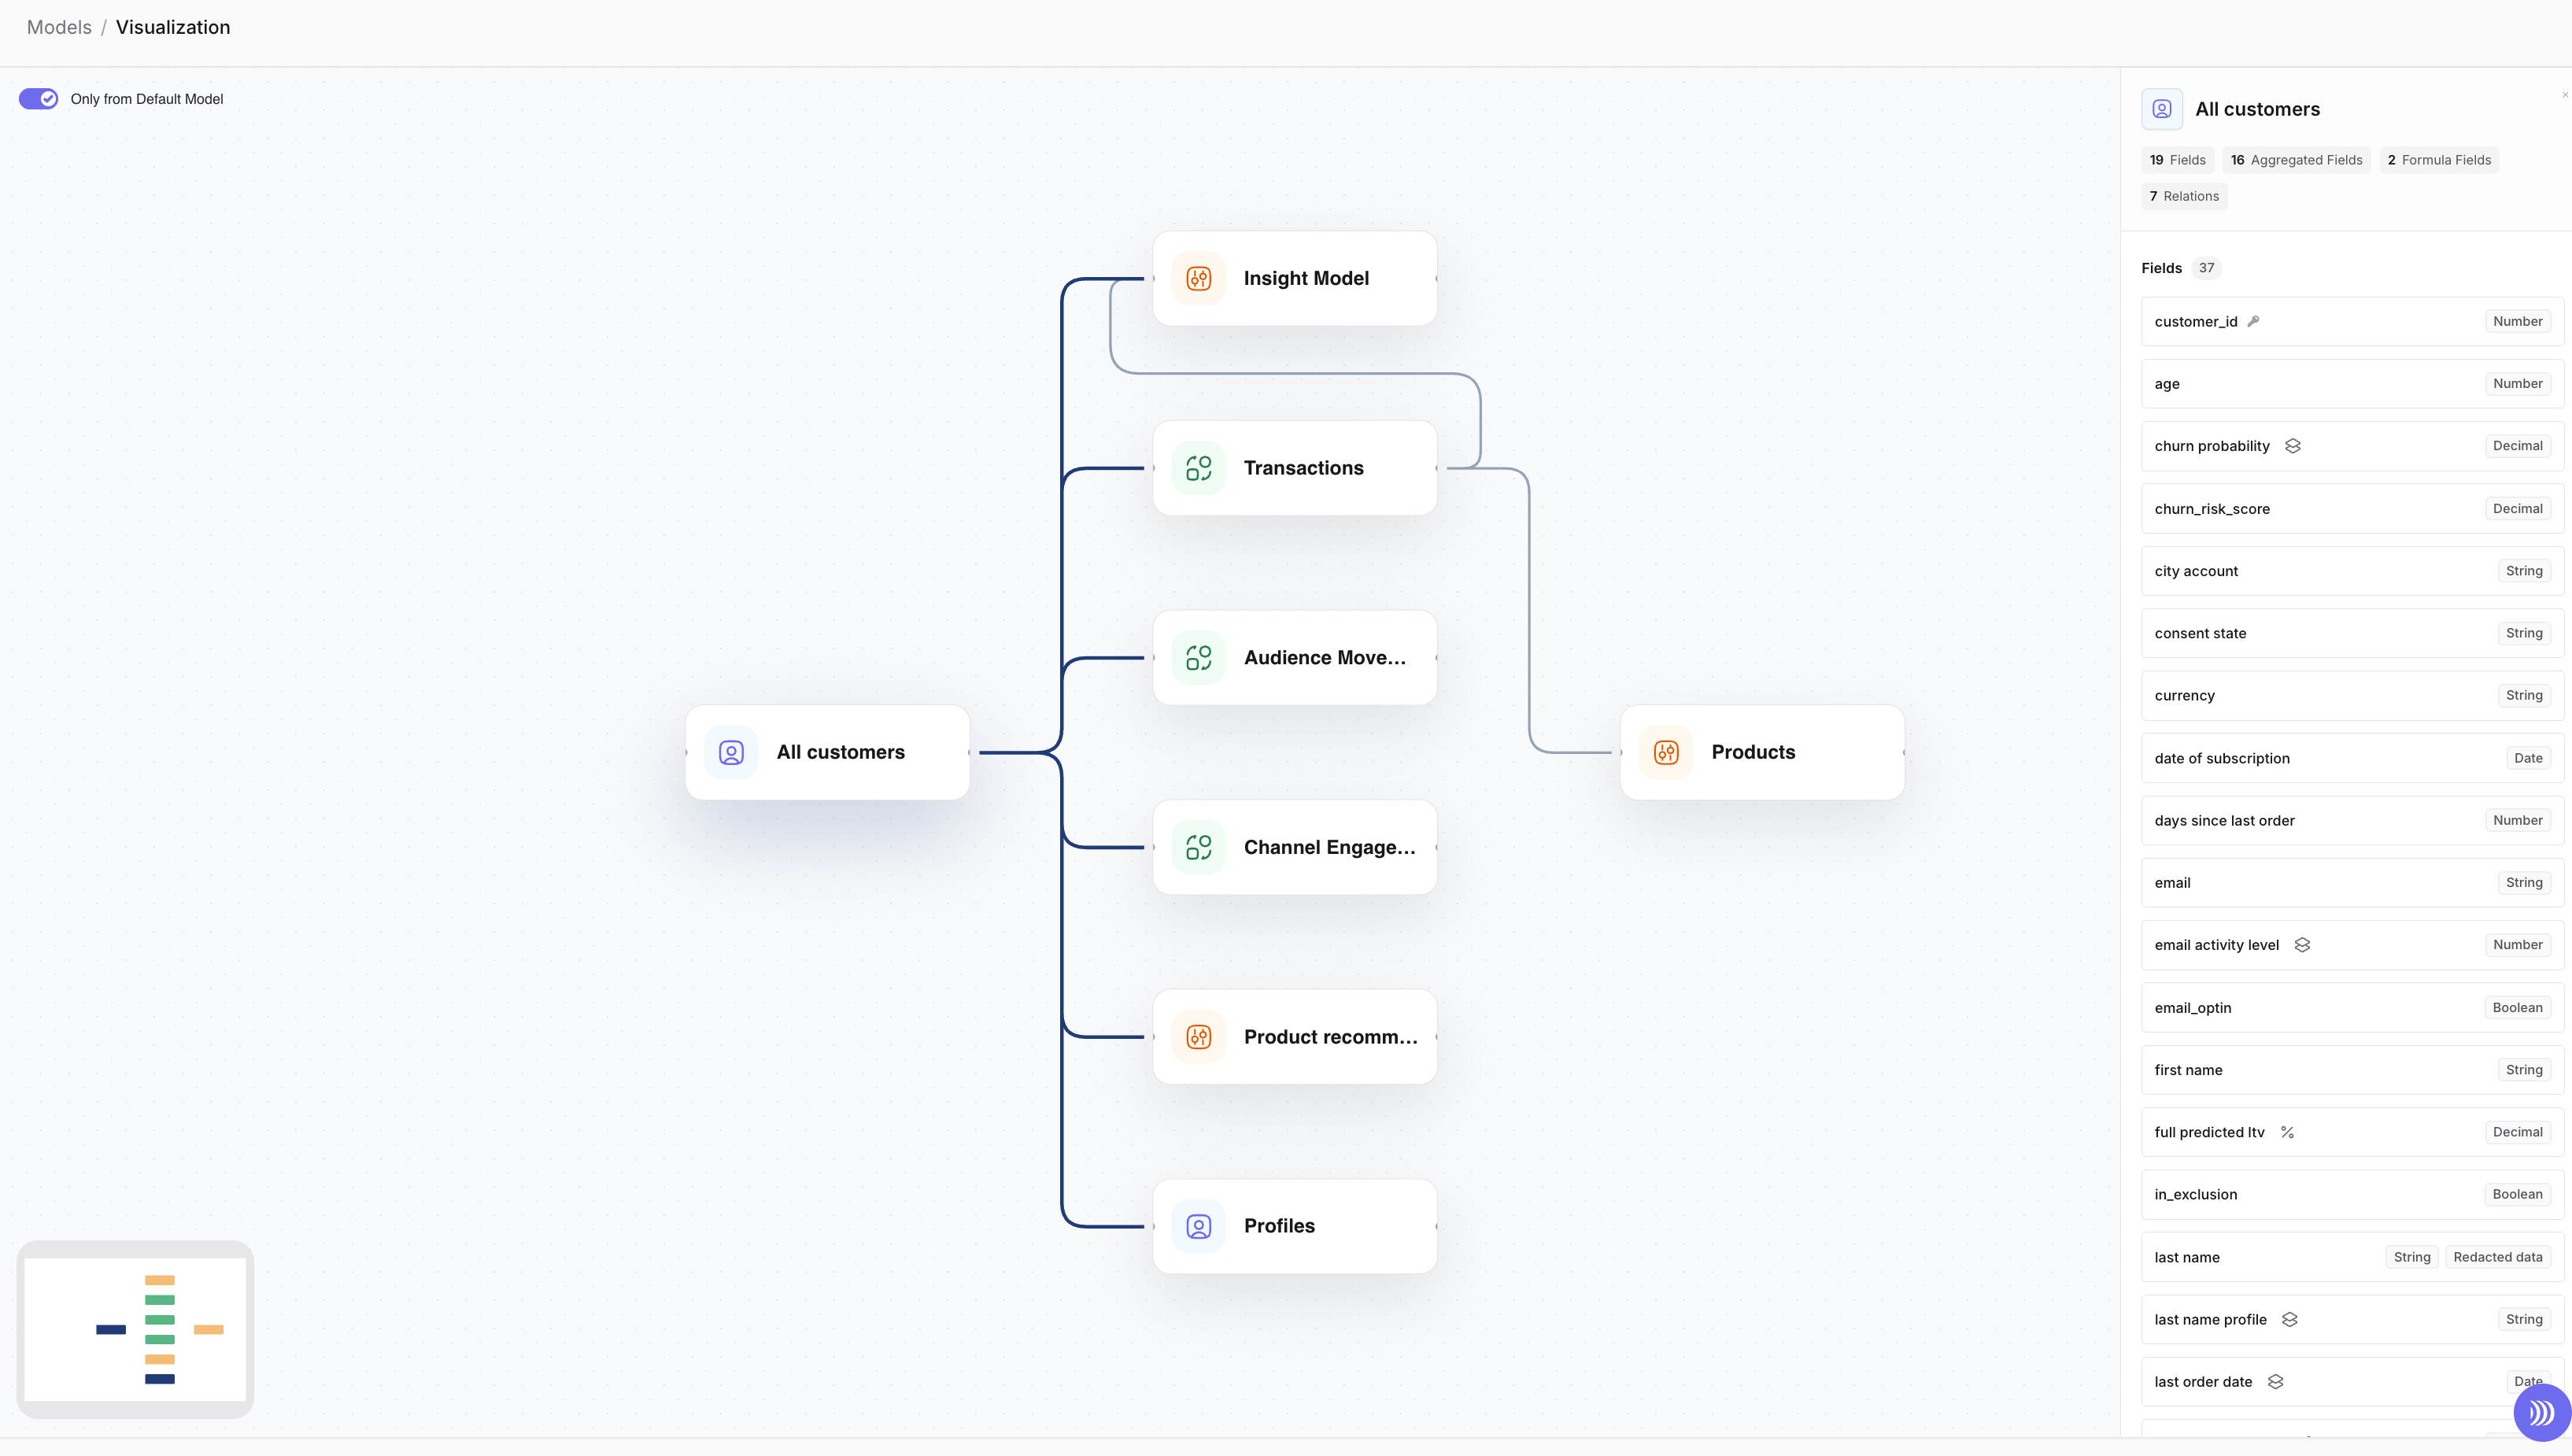
Graph view provides a visual map of the relationships between models in your workspace.
Use it to understand how customer, transaction, product, event, and other business models connect before building segments, computed fields, or activations.
Explore relationships between models from a visual diagram.
## Open Graph view
1. Open **Models**.
2. Select **Graph view**.
3. Use the diagram to explore the models and relationships in your workspace.
Turn on **Only from Default Model** to focus on the models connected to the default model.
## Understand relationships
Each card represents a model. Lines between cards represent the relationships configured between models.
Graph view helps you identify the relationship type, join keys, and upstream or downstream dependencies between models.
| Relationship | Meaning in DinMo |
| ------------ | ----------------------------------------------------------------------------------------------- |
| `1:1` | A **Has one** relationship: one record is associated with one record in another model. |
| `1:N` | A **Has many** relationship: one record is associated with several records in another model. |
| `N:1` | A **Belongs to** relationship: several records are associated with one record in another model. |
## Inspect a model
Select a model in the diagram to open its details panel.
The panel shows the model's fields and data types, as well as the number of computed fields and relationships associated with it. Use this information to understand which data is available before you use the model in a segment or activation.
## Use Graph view
Use Graph view to:
* Identify the right related model before building a segment.
* Understand which model should contain a computed field.
* Check how models are connected before creating a Related field.
* Share a clear view of the workspace data model with business and data teams.
---
# Agent Instructions
This documentation is published with GitBook. GitBook is the documentation platform designed so that both humans and AI agents can read, navigate, and reason over technical content effectively. Learn more at gitbook.com.
## Querying This Documentation
If you need additional information that is not directly available in this page, you can query the documentation dynamically by asking a question.
Perform an HTTP GET request on the current page URL with the `ask` query parameter, and the optional `goal` query parameter:
```
GET https://docs.dinmo.io/models/overview/graph-view.md?ask=&goal=
```
`ask` is the immediate question: it should be specific, self-contained, and written in natural language.
`goal` is optional and describes the broader end goal you are ultimately trying to accomplish on behalf of the user. GitBook uses it to tailor the answer towards what is most useful for that goal.
The response will contain a direct answer to the question and relevant excerpts and sources from the documentation.
Use this mechanism when the answer is not explicitly present in the current page, you need clarification or additional context, or you want to retrieve related documentation sections.